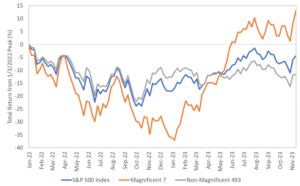
A lot of ink is being spilled writing about the Magnificent 7, the seven largest stocks by market capitalization in the S&P 500 index. That is not surprising given the rollercoaster ride they have been on over the last two years. After suffering a nearly 40% drawdown from the S&P 500 index peak of early 2022 (and significantly underperforming the broad market in the process), they have come back with a vengeance this year, recovering all their losses and recently breaking out to new highs. Meanwhile, the remaining 493 stocks in the S&P 500 index have trailed behind and are currently still more than 11% below their early 2022 peak. However, while the performance of the Non-Magnificent 493 has been, well, less magnificent, investors may be better served focusing on them going forward.
As the Magnificent 7 rebound, the Non-Magnificent 493 have trailed behind

Source: Congress Wealth Management, Bloomberg, as of 11/15/2023
The Magnificent 7 is a market-capitalization weighted average of AAPL, AMZN, GOOGL, META, MSFT, NVDA, TSLA
The Non-Magnificent 493 is a market-capitalization weighted average of the remining 493 stocks in the S&P 500 index after excluding the Magnificent 7
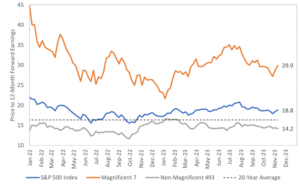
While the valuation of the Magnificent 7 has come down from the nosebleed levels of early 2022, they are far from undervalued. Their current price to 12-month forward earnings ratio of 29.9 is still almost twice the S&P 500 index’s 20-year average of 16.3. This is causing the S&P 500 index as a whole to appear somewhat overvalued, with a multiple of 18.8. However, once we strip out the Magnificent 7 and focus on the Non-Magnificent 493, the multiple drops to a measly 14.2, which is below the long-term average, indicating a certain degree of undervaluation. While valuation may not tell us much about how these stocks will perform next month or even next year, it has proven to be a reliable predictor of future long-term returns.
The Magnificent 7 are still expensive, while the Non-Magnificent 493 look like a bargain

Source: Congress Wealth Management, Bloomberg, as of 11/15/2023
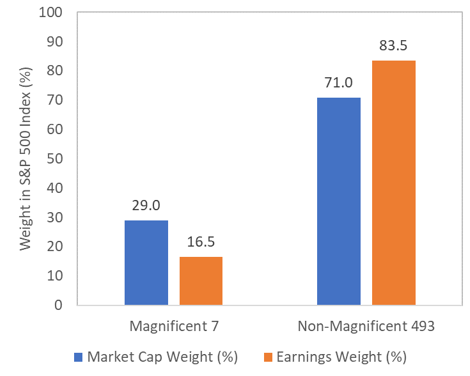
Another way to appreciate this divergence in valuation is to compare the weight of these stocks in the S&P 500 index and their earnings contribution to the index. The Magnificent 7 carry a market cap weight of 29%, but only represent 16.6% of the aggregate S&P 500 index earnings over the last 12 months. Meanwhile, the Non-Magnificent 493 make up 71% of the market capitalization of the index, but contribute 83.4% of the earnings. Historically, the market has exhibited a tendency for these two measures to converge. Investors currently expect that this will happen as a result of the Magnificent 7 being able to grow their future earnings at a much faster pace than that of the rest of the index. Specifically, consensus estimates for next year point to the Magnificent 7 growing their earnings by 28%, compared to just 13.2% for the Non-Magnificent 493. The spread is even wider if we look at analysts’ long-term growth estimates, which are supposed to cover the length of a full business cycle (basically a somewhat educated guess). Over this time frame, the expected growth rate for the Non-Magnificent 493 drops to 9.5%, while that of the Magnificent 7 rises to 29.8%.
The Non-Magnificent 493 are punching above their weight

Source: Congress Wealth Management, Bloomberg, as of 11/15/2023
This may sound great for the Magnificent 7, until one realizes that this is what is currently expected, and therefore is already reflected in market prices. Hence the premium that investors are currently willing to pay to own these stocks. In other words, the Magnificent 7 face a high hurdle to be able to beat expectations, and could come under pressure if those rosy estimates are even slightly disappointed. Meanwhile, the Non-Magnificent 493 face a much lower hurdle, and only need to be a little less non-magnificent in order to garner a renewed appreciation from investors.
The bottom line is: the Magnificent 7 may be grabbing headlines, but investors may be better off focusing on the Non-Magnificent 493 going forward.
Sauro Locatelli CFA, FRM™, SCR™
Director of Quantitative Research
Congress Wealth Management LLC (“Congress”) is a registered investment advisor with the U.S. Securities and Exchange Commission (“SEC”). Registration does not imply a certain level of skill or training. For additional information, please visit our website at congresswealth.com or visit the Investment Adviser Public Disclosure website at www.adviserinfo.sec.gov by searching with Congress’ CRD #310873.
This note is provided for informational purposes only. Congress believes this information to be accurate and reliable but does not warrant it as to completeness or accuracy. This note may include candid statements, opinions and/or forecasts, including those regarding investment strategies and economic and market conditions; however, there is no guarantee that such statements, opinions and/or forecasts will prove to be correct. All such expressions of opinions or forecasts are subject to change without notice. Any projections, targets or estimates are forward looking statements and are based on Congress’ research, analysis, and assumption. Due to rapidly changing market conditions and the complexity of investment decisions, supplemental information and other sources may be required to make informed investment decisions based on your individual investment objectives and suitability specifications. This note is not a complete analysis of all material facts respecting any issuer, industry or security or of your investment objectives, parameters, needs or financial situation, and therefore is not a sufficient basis alone on which to base an investment decision. Clients should seek financial advice regarding the appropriateness of investing in any security or investment strategy discussed or recommended in this note. No portion of this note is to be construed as a solicitation to buy or sell a security or the provision of personalized investment, tax or legal advice. Investing entails the risk of loss of principal.


Comments are closed.