

The S&P 500 is currently down roughly 16% so far this year, which would make 2022 its worst calendar year since the Great Financial Crisis (GFC), and would also fall in the lowest decile of historical calendar year returns since the Great Depression (GD). So, to say that 2022 has not been a Great (pun intended) year for risk assets (or even “safe” assets for that matter) would be a euphemism. However, the bright side of such a lackluster year for stocks is that it has brought along what we would theme the Great Valuation Reset (GVR), which saw sky-high valuations fall back to Earth (and in some instances below Earth) in very short order.
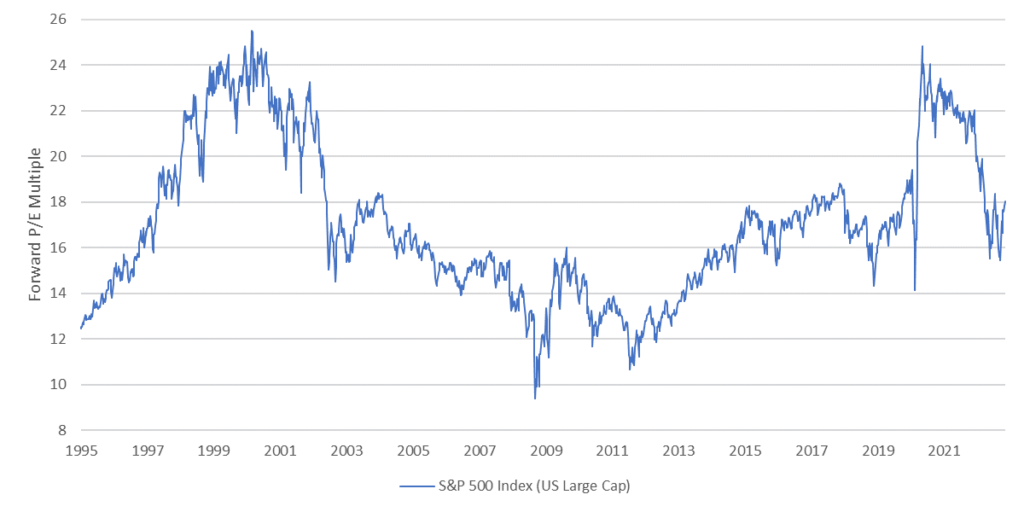
When we review and discuss valuation internally, we typically rely on a weight-of-the-evidence approach that combines as many different valuation measures as we think are relevant to each case, including both forward-looking and trailing multiples of earnings, sales, cashflows, dividends, book value of equity, etcetera. However, for the purpose of this exercise, the forward price-to-earnings multiple will suffice as a summary statistic to illustrate how the valuation of different stock indexes has evolved recently, starting with the S&P 500 index.
After peaking in June 2020 at around 25 (which is approximately where it peaked during the tech bubble in 2000), the forward price-to-earnings (P/E) multiple for the S&P 500 index started this year at 22, and then fell to a low of 15.5 in October. A drop of 6.5 points over a span of just 10 months is almost unprecedented, with only one other episode of such vicious repricing occurring in recent history, as a result of the popping of the tech bubble in 2002. The multiple for the S&P 500 index has since rebounded slightly to 18, which is roughly in line with its average for the last 10 years.
Please keep these numbers in mind if and when you are considering making a drastic change to your portfolio allocation, such as going to cash.
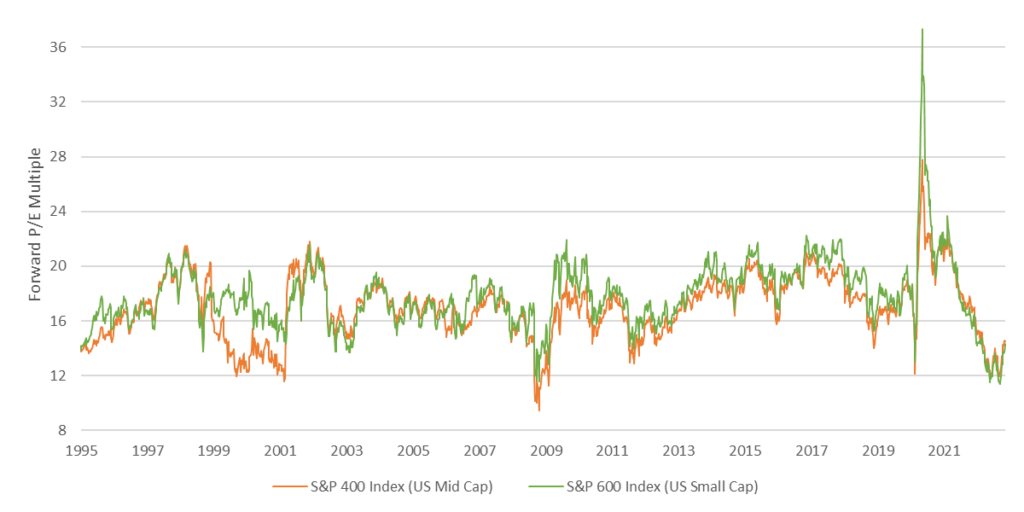
The GVR has been even more pronounced in mid and small capitalization stocks. The forward P/E multiple for small caps (based on the S&P 600 index) peaked at a whopping 37.3 in June 2020, and then fell by over 2/3rds to an all-time low of 11.5 in October of this year. The P/E multiple for mid caps (based on the S&P 400 index) peaked at a lower level of 28 in June 2020 but followed a similar path and also bottomed out at around 11.5 this October. As a result, both small and mid caps are currently trading at a significant discount relative to large caps.
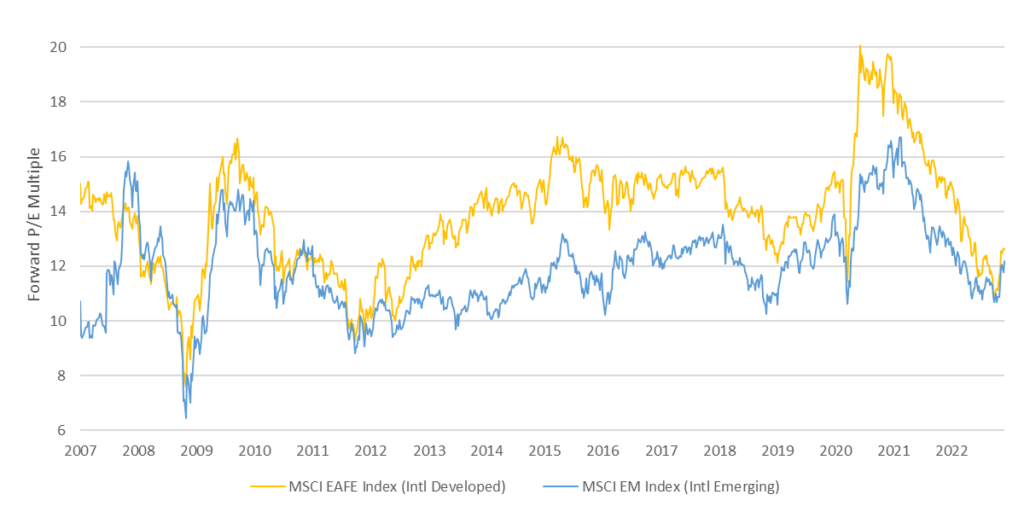
International markets were obviously not spared from the GVR. Both developed markets (based on the MSCI EAFE index) and emerging markets (based on the MSCI EM index) saw their forward P/E multiples decline significantly over the last couple of years, with the decline in developed markets being more pronounced. Their multiple peaked at a much higher level but ended up bottoming at roughly the same level as emerging markets. Both are currently trading just above 12x forward earnings, which makes them attractively valued relative to US large caps. In addition, after an impressive run over the last couple of years, the US dollar is now overvalued against most foreign currencies. Given that international markets are denominated in foreign currency, this makes them doubly attractive from a valuation perspective.
Valuation doesn’t tell us much about what stocks will do over the next 1, 3, 6, and sometimes even 12 months. However, it tells a lot about what stocks will do over the next 5 to 10 years. Over such time frame, the key takeaways from the GVR should be the following:
- Before this year, stocks were priced to deliver measly returns going forward. They are now priced to deliver much healthier returns, which in the case of US large caps should be close to their very long-term average.
- US small and mid cap stocks as well as international stocks are now priced to deliver above-average returns going forward, which puts them in a position to outperform US large caps and gives rise to attractive investment opportunities.
Sauro Locatelli CFA, FRM™, SCR™
Director of Quantitative Research
Congress Wealth Management LLC (“Congress”) is a registered investment advisor with the U.S. Securities and Exchange Commission (“SEC”). Registration does not imply a certain level of skill or training. For additional information, please visit our website at congresswealth.com or visit the Investment Adviser Public Disclosure website at www.adviserinfo.sec.gov by searching with Congress’ CRD #310873.
This note is provided for informational purposes only. Congress believes this information to be accurate and reliable but does not warrant it as to completeness or accuracy. This note may include candid statements, opinions and/or forecasts, including those regarding investment strategies and economic and market conditions; however, there is no guarantee that such statements, opinions and/or forecasts will prove to be correct. All such expressions of opinions or forecasts are subject to change without notice. Any projections, targets or estimates are forward looking statements and are based on Congress’ research, analysis, and assumption. Due to rapidly changing market conditions and the complexity of investment decisions, supplemental information and other sources may be required to make informed investment decisions based on your individual investment objectives and suitability specifications. This note is not a complete analysis of all material facts respecting any issuer, industry or security or of your investment objectives, parameters, needs or financial situation, and therefore is not a sufficient basis alone on which to base an investment decision. Clients should seek financial advice regarding the appropriateness of investing in any security or investment strategy discussed or recommended in this note. No portion of this note is to be construed as a solicitation to buy or sell a security or the provision of personalized investment, tax or legal advice. Investing entails the risk of loss of principal.


Comments are closed.