Last week brought us fresh evidence that inflation continues to cool rapidly. On Wednesday, the Bureau of Labor Statistics reported that the Consumer Price Index (CPI) only increased by 0.18% in June, after increasing by just 0.12% in May. This means that over the last two months, CPI increased at an annualized rate of just 1.8%, which is below the Fed’s target of 2%. Moreover, the core version of CPI, which excludes food and energy prices, only increased by 0.16% in June, which annualizes to 1.89%. That is also below the Fed’s target of 2%, and it is the slowest monthly increase in core CPI since February 2021.
While this data only covers a relatively short period of time, we think it represents the continuation of a disinflationary trend that has been in place since the middle of last year. Most importantly, we think this trend will persist going forward, and will likely even accelerate over the next few quarters. More specifically, there is one component of the CPI basket that jumps out for having the potential to exert significant downside pressure on the index over the next few quarters. That component is shelter (i.e. housing), and it stands out for the following reasons:
- It makes up a whopping 34% of the CPI basket and 44% of the core CPI basket.
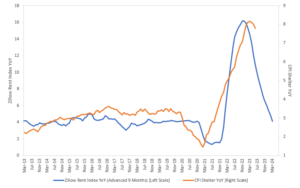
- It has barely begun to roll over from its peak (see orange line below).
- Real-time indicators such as the Zillow Rent Index suggest it is about to plummet (see blue line below).
While shelter is most definitely not the only component of CPI that is headed lower, it is the one that will likely have the biggest contribution toward pushing and keeping inflation lower for the foreseeable future.

Source: Congress Wealth, Zillow Inc., Bureau of Labor Statistics, Bloomberg, as of 7/17/2023
The table below breaks historical values of the VIX index since 1990 into a few different ranges, ranked from the lowest (below 15) to the highest (above 35). For each range, the table reports the average S&P 500 index return over the following 12 months, the average drawdown over the same period, and the frequency of occurrence of each range. From the table, we can make two main observations:
- First, the table confirms that spikes in the VIX provide great buying opportunities. Values of the VIX above 35 are rare, historically occurring just over 4% of the time. However, when they do occur, they are followed by average 12-month forward returns of 29.3%!
- Second, the table disproves the idea that low levels of the VIX should be used as selling opportunities. Values of the VIX below 15 are far more common than values above 35, occurring over 33% of the time. Average returns over the following 12 months come in at a not-so-shabby 10.4%, which is certainly lower than 29.3%, but higher than the overall average of 9.2%. Perhaps more interestingly, these returns come with an average drawdown of just -4.6%, which is nearly half as much as the overall average of -8.0%.
In summary, low levels of the VIX are associated with still-solid forward returns, and these returns are a lot less risky than the ones associated with higher levels of the VIX. History says that investors using the excuse of a low VIX index to get out of stocks may end up spending a lot of time out of the market, potentially missing out on significant gains.

Source: Bloomberg, as of 7/17/2023
Sauro Locatelli CFA, FRM™, SCR™
Director of Quantitative Research
Congress Wealth Management LLC (“Congress”) is a registered investment advisor with the U.S. Securities and Exchange Commission (“SEC”). Registration does not imply a certain level of skill or training. For additional information, please visit our website at congresswealth.com or visit the Investment Adviser Public Disclosure website at www.adviserinfo.sec.gov by searching with Congress’ CRD #310873.
This note is provided for informational purposes only. Congress believes this information to be accurate and reliable but does not warrant it as to completeness or accuracy. This note may include candid statements, opinions and/or forecasts, including those regarding investment strategies and economic and market conditions; however, there is no guarantee that such statements, opinions and/or forecasts will prove to be correct. All such expressions of opinions or forecasts are subject to change without notice. Any projections, targets or estimates are forward looking statements and are based on Congress’ research, analysis, and assumption. Due to rapidly changing market conditions and the complexity of investment decisions, supplemental information and other sources may be required to make informed investment decisions based on your individual investment objectives and suitability specifications. This note is not a complete analysis of all material facts respecting any issuer, industry or security or of your investment objectives, parameters, needs or financial situation, and therefore is not a sufficient basis alone on which to base an investment decision. Clients should seek financial advice regarding the appropriateness of investing in any security or investment strategy discussed or recommended in this note. No portion of this note is to be construed as a solicitation to buy or sell a security or the provision of personalized investment, tax or legal advice. Investing entails the risk of loss of principal.


Comments are closed.