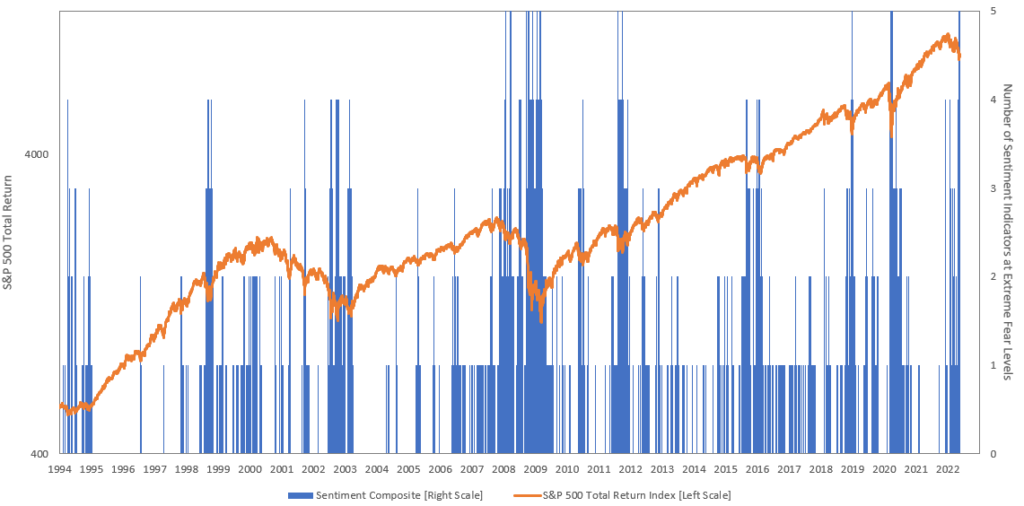
Over the last few turbulent months, we have highlighted a few individual sentiment indicators as they reached extreme bearish levels at one point or another. However, what was exceptional about last week is that a large number of these sentiment indicators all reached extreme bearish levels at the same time. To measure this, we created a sentiment composite based on the five indicators shown in the table below. The sentiment composite measures how many of these five indicators are hitting extreme bearish levels (defined as the most extreme 10% of historical observations) at any point in time, ranging from 0 to 5 out of 5.
| Sentiment Indicator | Extreme Bearish Threshold | |
|---|---|---|
| VIX Index | > | 29.5 |
| Put/Call Ratio | > | 1.0 |
| AAII Bull – Bear Survey | < | -14.4 |
| NYSE Stocks Above Their 200-Day Moving Average | < | 27% |
| NYSE Stock Making New 52-Week Highs – Lows | < | -97.0 |
The historical readings of such sentiment composite are shown in blue in the chart below, alongside the S&P 500 index in orange. The sentiment composite hit 5 out of 5 last week, first on Tuesday and then again on Thursday. Readings of 5 out of 5 have been exceptionally rare, occurring only about 0.5% of the time since 1994, and they tend to coincide with major lows in stocks. More importantly, they tend to precede violent rebounds. As the table below shows, following readings of 5 out of 5 of the sentiment composite, forward S&P 500 returns have historically averaged over 5% one month out and over 28% one year out. Returns have been significantly above average even following a reading of 3 and 4 on the sentiment composite, which have also been fairly rare historically.


The bottom line is that it is usually a bad idea to sell stocks when sentiment is extremely bearish, which is when things look the scariest.
Sauro Locatelli CFA, FRM™, SCR™
Director of Quantitative Research
Congress Wealth Management LLC (“Congress”) is a registered investment advisor with the U.S. Securities and Exchange Commission (“SEC”). Registration does not imply a certain level of skill or training. For additional information, please visit our website at congresswealth.com or visit the Investment Adviser Public Disclosure website at www.adviserinfo.sec.gov by searching with Congress’ CRD #310873.
This note is provided for informational purposes only. Congress believes this information to be accurate and reliable but does not warrant it as to completeness or accuracy. This note may include candid statements, opinions and/or forecasts, including those regarding investment strategies and economic and market conditions; however, there is no guarantee that such statements, opinions and/or forecasts will prove to be correct. All such expressions of opinions or forecasts are subject to change without notice. Any projections, targets or estimates are forward looking statements and are based on Congress’ research, analysis, and assumption. Due to rapidly changing market conditions and the complexity of investment decisions, supplemental information and other sources may be required to make informed investment decisions based on your individual investment objectives and suitability specifications. This note is not a complete analysis of all material facts respecting any issuer, industry or security or of your investment objectives, parameters, needs or financial situation, and therefore is not a sufficient basis alone on which to base an investment decision. Clients should seek financial advice regarding the appropriateness of investing in any security or investment strategy discussed or recommended in this note. No portion of this note is to be construed as a solicitation to buy or sell a security or the provision of personalized investment, tax or legal advice. Investing entails the risk of loss of principal.


Comments are closed.