

This note is going to go into some of the more granular, monthly technical work that we do, but with technicals being an important ‘building block’ in our investment process we thought it was important to share. And it’s all about monthly candles.
Candles are a charting method to denote open, close, high, and low for the period you are analyzing. The color of the body tells you if the period saw a close higher or lower than the open. In the following charts, a red candle is a down month, and a white candle is an up month. With that small amount of background, May 2023 is in the books, and we have a new, full monthly candle officially printed.
For May, the S&P 500 opened at 4166, closed at 4179 with a high of 4231 and a low of 4048. This was a very minor up month as the S&P moved 0.31% higher but that small gain provided interesting information. First, as small as it was, May was the 3rd straight month of gains for the index. Second, May was the highest close in 13 months back to April of 2022. This is not bear market behavior. Since 1960, only one bear market, late 2001, had a string of 3 monthly gains before moving to new lows, and 13-month new highs have never occurred during a continuing bear market.
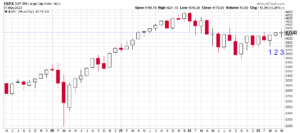
Source: Stockcharts.com as of 5/31/2023
Moving to a longer-term chart, momentum (monthly RSI) (in the bottom panel) is starting to pick up after working off the euphoria of 2021. As marked by the blue horizontal lines, corrections in the S&P that have pushed momentum back around the midline at 50 marked great buying opportunities since 2009. It was only during the last two recessions in 2001 and 2008 that momentum become completely oversold, as marked by the red lines (COVID recession was way too quick to push momentum lower than 50).
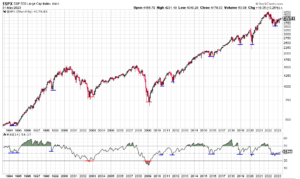
Source: Stockcharts.com as of 5/31/2023
Last but not least, the May monthly candle is the first candle since March of 2022 to close above the long-term trend. This chart is looking at the 20-month moving average (MA) in the S&P 500, which does a great job of capturing the long-term trend. Simplistically, when price is below the 20-month MA and that MA is sloped lower, it is a bear market. As of last month, S&P (barely) closed above the 20-month MA, and it has started to flatten instead of remaining sloped lower.
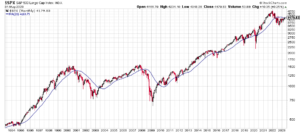
Source: Stockcharts.com as of 5/31/2023
This is a small peek into the technicals that we study; these studies help shape our market view. The last few months price movement is more consistent with bull markets, momentum is picking up after correcting, and trend evidence is moving from bear to bull. The conclusion here is that recessionary price action COULD start again, but the May candle information still points to a high probability that last October was the low.
Sean Dillon, CMT, CFTe
SVP, Investment Strategy
Congress Wealth Management LLC (“Congress”) is a registered investment advisor with the U.S. Securities and Exchange Commission (“SEC”). Registration does not imply a certain level of skill or training. For additional information, please visit our website at congresswealth.com or visit the Investment Adviser Public Disclosure website at www.adviserinfo.sec.gov by searching with Congress’ CRD #310873.
This note is provided for informational purposes only. Congress believes this information to be accurate and reliable but does not warrant it as to completeness or accuracy. This note may include candid statements, opinions and/or forecasts, including those regarding investment strategies and economic and market conditions; however, there is no guarantee that such statements, opinions and/or forecasts will prove to be correct. All such expressions of opinions or forecasts are subject to change without notice. Any projections, targets or estimates are forward looking statements and are based on Congress’ research, analysis, and assumption. Due to rapidly changing market conditions and the complexity of investment decisions, supplemental information and other sources may be required to make informed investment decisions based on your individual investment objectives and suitability specifications. This note is not a complete analysis of all material facts respecting any issuer, industry or security or of your investment objectives, parameters, needs or financial situation, and therefore is not a sufficient basis alone on which to base an investment decision. Clients should seek financial advice regarding the appropriateness of investing in any security or investment strategy discussed or recommended in this note. No portion of this note is to be construed as a solicitation to buy or sell a security or the provision of personalized investment, tax or legal advice. Investing entails the risk of loss of principal.


Comments are closed.