

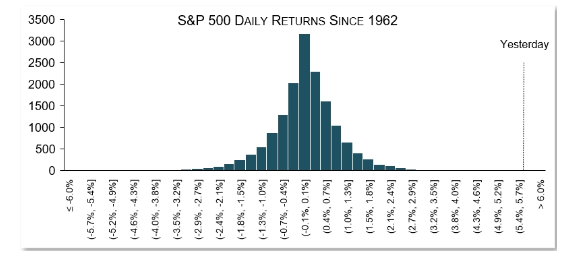
How historic was the move in equities yesterday? The chart below shows the distribution of returns for the S&P 500 going back to 1962. The S&P 500 gain of 5.54% was only eclipsed 14 times in history which is .09% of daily returns. You don’t get many days like that!
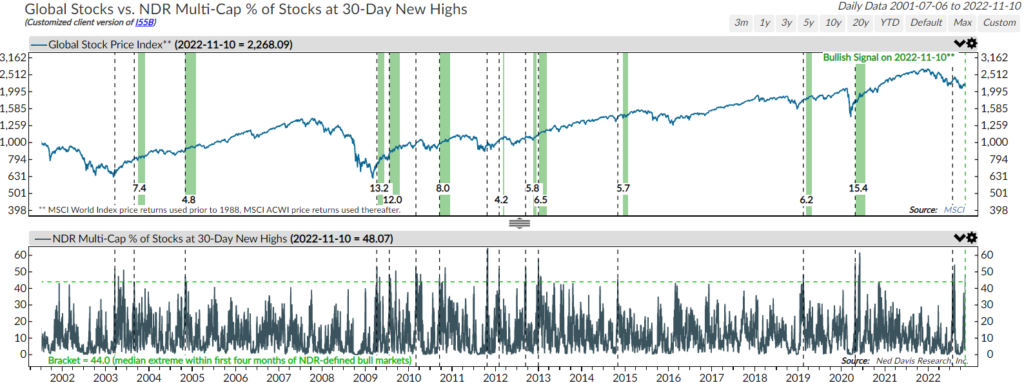
Internally, more and more positive technical signs are emerging. Breadth thrusts are starting to show up again. One example was a jump to 48% in the percentage of stocks making new 30 day highs which happens after long bear markets or during strong bull markets. This follows other thrust indicators triggering buy signals including stocks above 10 day moving average thrust and the three-day price thrust that signaled at the end of October.
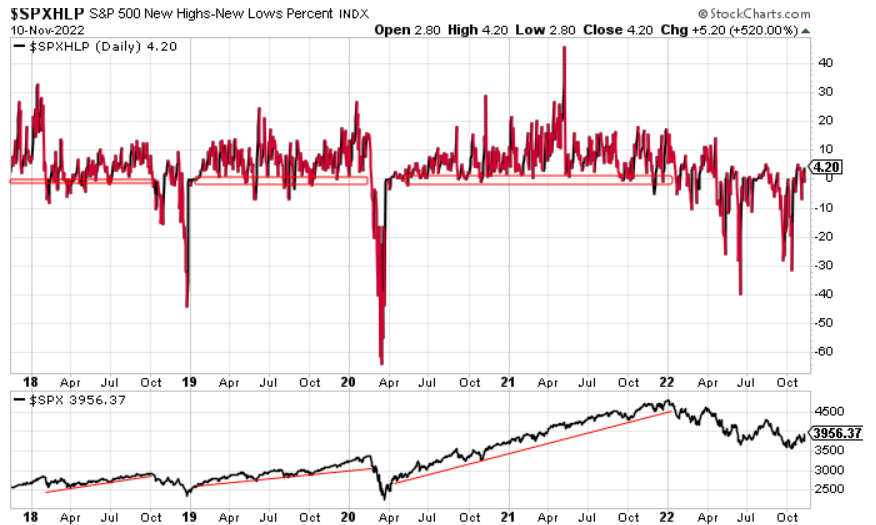
I like the new saying ‘Thrust But Verify’. And that is where we are focusing our attention over the next few weeks. Bull markets are characterized by more and more stocks making 52-week new highs. The S&P 500 had 4.2% of all stocks make a 52-week new high yesterday. A good first step but I want to see this number continuing to rise and stay near or above 0% for that is how bull markets act.
I wanted to make this quick although I could go on and on about improving market action. The US dollar potentially made an important top, the drop in yields was historic, mortgage spreads collapsed, corporate spreads moved back below 150, a few global indices jumped to new 52-week highs, high beta outperformed low beta by the most since the November vaccine announcement.
Has another major bottom been formed? No one knows for sure until well after the fact. But once again we are seeing encouraging signs at a point in time when equities are supposed to move higher (post mid-term election seasonality). Hopefully that helps brighten your mood as we head into this rainy November weekend.
Sean Dillon, CMT, CFTe
SVP, Investment Strategies
Congress Wealth Management LLC (“Congress”) is a registered investment advisor with the U.S. Securities and Exchange Commission (“SEC”). Registration does not imply a certain level of skill or training. For additional information, please visit our website at congresswealth.com or visit the Investment Adviser Public Disclosure website at www.adviserinfo.sec.gov by searching with Congress’ CRD #310873.
This note is provided for informational purposes only. Congress believes this information to be accurate and reliable but does not warrant it as to completeness or accuracy. This note may include candid statements, opinions and/or forecasts, including those regarding investment strategies and economic and market conditions; however, there is no guarantee that such statements, opinions and/or forecasts will prove to be correct. All such expressions of opinions or forecasts are subject to change without notice. Any projections, targets or estimates are forward looking statements and are based on Congress’ research, analysis, and assumption. Due to rapidly changing market conditions and the complexity of investment decisions, supplemental information and other sources may be required to make informed investment decisions based on your individual investment objectives and suitability specifications. This note is not a complete analysis of all material facts respecting any issuer, industry or security or of your investment objectives, parameters, needs or financial situation, and therefore is not a sufficient basis alone on which to base an investment decision. Clients should seek financial advice regarding the appropriateness of investing in any security or investment strategy discussed or recommended in this note. No portion of this note is to be construed as a solicitation to buy or sell a security or the provision of personalized investment, tax or legal advice. Investing entails the risk of loss of principal.


Comments are closed.