At the time of writing, the S&P 500 index is in the midst of a nearly 5% pullback from its recent peak on 7/31. Corrections of this sort have been a remarkably frequent occurrence in the history of the stock market. Since January 1928, the S&P 500 index has suffered a total of 328 pullbacks greater than 5%, or roughly 3.5 per year on average. Coincidentally, this would be the third correction in the 5-10% range that the market has experienced over the course of the advance that began roughly a year ago. Corrections of this sort are not just frequent, but are also healthy, in so far as they serve to remind investors that stocks don’t just go straight up, as they seemed to be doing over the last few months. Afterall, there is a reason why the S&P 500 index has returned more than 10%/year on average over the last 30 years while Treasury bills have returned just over 2%/year. This so-called equity risk premium results from the fact that stocks are, well, risky. However, investors’ perception of risk, which is well captured by sentiment measures such as the put-call ratio and the bull-bear spread, is not constant but rather varies significantly over time. These variations are mostly explained by what the market has done recently. Sean would say that sentiment follows price, I would call it recency bias. What is more interesting (and useful) is that sentiment can then affect what the market will do next.
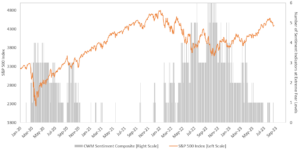
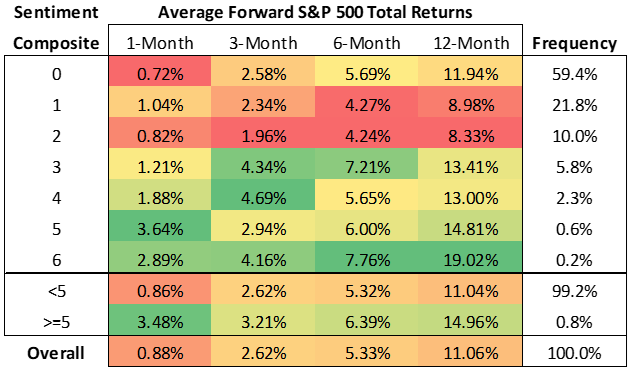
In the second half of last year, when the S&P 500 index was in the process of testing its bear market lows, we highlighted a few times how sentiment had reached extremely pessimistic levels. This was clear from our proprietary sentiment composite (shown in the chart below), which measures how many out of 6 widely used sentiment indicators are in their most bearish 10% of historical observations. As the composite repeatedly registered at 5/6 and even 6/6, which is a rare occurrence, we pointed out how those readings have historically been followed by much stronger than average market returns (highlighted in the table below the chart). The signal provided by our sentiment composite proved very valuable, as the S&P 500 index went on to enjoy significant near-term rebounds which laid the basis for the advance that carried us into this year.
Fast forward to today, and the sentiment landscape looks dramatically different. Currently, 0 out of 6 of the sentiment measures in our composite are hitting extremely pessimistic levels. This is not in and of itself a bad thing, as this is actually a normal condition that has occurred roughly 60% of the time since 1994, with average forward returns being roughly in line with the overall average. However, it does mean that a meaningful tailwind that was behind the market advance that began last year has now dissipated. Moreover, before the current market correction began, some of the sentiment measures in our composite were not just not hitting extremely pessimistic levels, but were actually approaching extremely optimistic ones. That was a sign that this bull market was marching at an unsustainable pace and was due for a breather. While the correction we have experienced so far has been enough to clear some of the froth, it will take a more meaningful decline before we see anything close to the degree of pessimism that prevailed last year. The good news is that we don’t need sentiment to get extremely pessimistic for the correction to end. However, if it gets there, that will be a clear sign that the selling has gone too far.

Source: Congress Wealth Management, Bloomberg, as of 8/22/2023

Source: Congress Wealth Management, Bloomberg, based on data since January 1994, as of 8/22/2023
Sauro Locatelli CFA, FRM™, SCR™
Director of Quantitative Research
Congress Wealth Management LLC (“Congress”) is a registered investment advisor with the U.S. Securities and Exchange Commission (“SEC”). Registration does not imply a certain level of skill or training. For additional information, please visit our website at congresswealth.com or visit the Investment Adviser Public Disclosure website at www.adviserinfo.sec.gov by searching with Congress’ CRD #310873.
This note is provided for informational purposes only. Congress believes this information to be accurate and reliable but does not warrant it as to completeness or accuracy. This note may include candid statements, opinions and/or forecasts, including those regarding investment strategies and economic and market conditions; however, there is no guarantee that such statements, opinions and/or forecasts will prove to be correct. All such expressions of opinions or forecasts are subject to change without notice. Any projections, targets or estimates are forward looking statements and are based on Congress’ research, analysis, and assumption. Due to rapidly changing market conditions and the complexity of investment decisions, supplemental information and other sources may be required to make informed investment decisions based on your individual investment objectives and suitability specifications. This note is not a complete analysis of all material facts respecting any issuer, industry or security or of your investment objectives, parameters, needs or financial situation, and therefore is not a sufficient basis alone on which to base an investment decision. Clients should seek financial advice regarding the appropriateness of investing in any security or investment strategy discussed or recommended in this note. No portion of this note is to be construed as a solicitation to buy or sell a security or the provision of personalized investment, tax or legal advice. Investing entails the risk of loss of principal.


Comments are closed.