

The 200-day moving average (ma) is no silver bullet; but as we reflect on price movement over the last few months it does provide us with pieces to the puzzle.
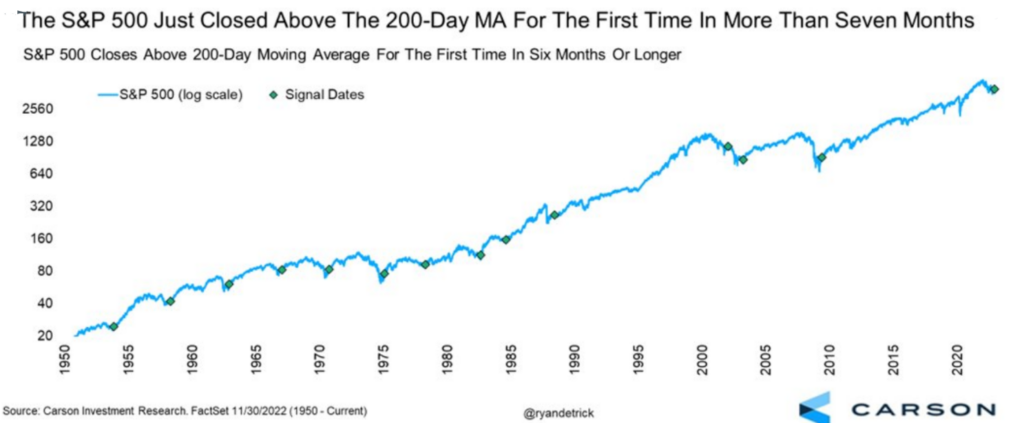
The S&P 500 crossed below the 200-day moving average on April 8, 2022, and it remained there for over 7 months. That is until the price surge yesterday moved price back above the average. As detailed in the chart below this is a rare occurrence happening only 13 other times since 1950. And according to Ryan Detrick, the S&P 500, 1 year later, was up 12 out of 13 times with an average gain of 18.8%. A bullish development.
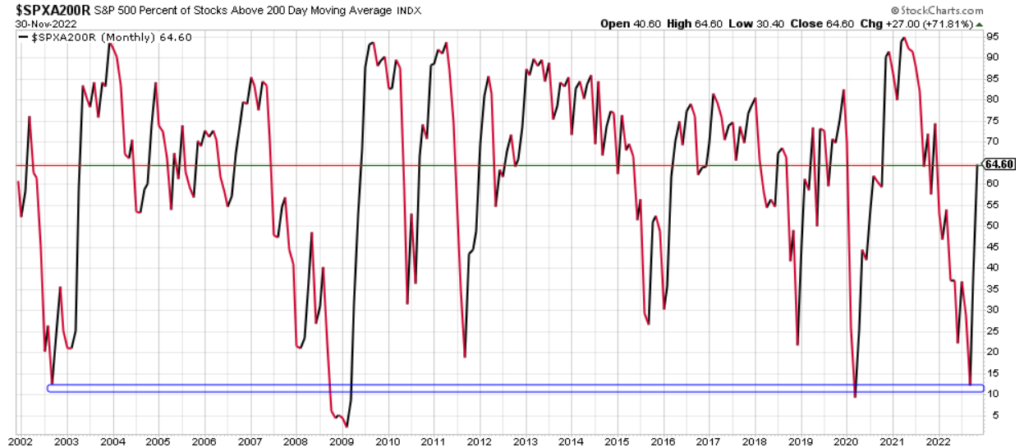
How about individual stocks in the S&P 500? Well, we have seen quite the recovery in the breadth of the market. 64.6% of stocks in the S&P 500 are above their 200-day ma which is the highest percentage since January and is quite the improvement from the September low of 12.5% of stocks. Going back to 2002, the last three times we saw this type of breadth improvement was the beginning of 2003 and 2009, and the end of 2020. A bullish development.
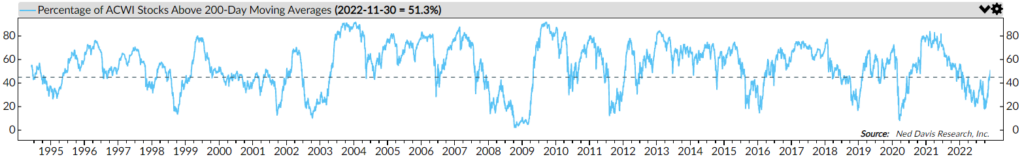
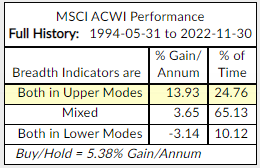
Additionally, we see this improvement all over the world. The percentage of global stocks above the 200-day ma just moved back to 51.3% which historically has been a great signal for world equity markets. Ned Davis combines this long-term breadth improvement with short term breadth (percent of stocks above the 50-day ma which currently stands at 82.5%) and the gains per annum have been 13.93% compared to the average back to 1994 of 5.38%. A bullish development.
Of course, the market could just fall apart here. War, energy security, recession risk, zero Covid policies, the Fed, etc. Technicals and studies like the ones above around the 200-day ma are just one part of overall investment process. But isn’t it possible market action is telling us good things lie ahead?
Sean Dillon, CMT, CFTe
SVP, Investment Strategies
Congress Wealth Management LLC (“Congress”) is a registered investment advisor with the U.S. Securities and Exchange Commission (“SEC”). Registration does not imply a certain level of skill or training. For additional information, please visit our website at congresswealth.com or visit the Investment Adviser Public Disclosure website at www.adviserinfo.sec.gov by searching with Congress’ CRD #310873.
This note is provided for informational purposes only. Congress believes this information to be accurate and reliable but does not warrant it as to completeness or accuracy. This note may include candid statements, opinions and/or forecasts, including those regarding investment strategies and economic and market conditions; however, there is no guarantee that such statements, opinions and/or forecasts will prove to be correct. All such expressions of opinions or forecasts are subject to change without notice. Any projections, targets or estimates are forward looking statements and are based on Congress’ research, analysis, and assumption. Due to rapidly changing market conditions and the complexity of investment decisions, supplemental information and other sources may be required to make informed investment decisions based on your individual investment objectives and suitability specifications. This note is not a complete analysis of all material facts respecting any issuer, industry or security or of your investment objectives, parameters, needs or financial situation, and therefore is not a sufficient basis alone on which to base an investment decision. Clients should seek financial advice regarding the appropriateness of investing in any security or investment strategy discussed or recommended in this note. No portion of this note is to be construed as a solicitation to buy or sell a security or the provision of personalized investment, tax or legal advice. Investing entails the risk of loss of principal.


Comments are closed.